Reference Guide · Forage Quality · Updated August 2026
Forage Quality Testing Guide: NDF, ADF, RFV and CP Explained
A forage quality test report contains 10–20 numbers — but four drive virtually every commercial hay pricing and livestock nutrition decision: CP (crude protein), NDF (neutral detergent fiber), ADF (acid detergent fiber) 그리고 RFV (relative feed value). This guide explains each parameter in plain terms, shows how they interact, and demonstrates how to convert a lab report into a market value and livestock feeding decision.
Covers: the 4 key forage parameters explained · USDA hay grading standards · how to collect a representative sample · how to read a lab report · market value implications · how baling decisions affect test results
Four Numbers That Drive Every Hay Market Transaction
CP (Crude Protein): nitrogen content × 6.25. Key for livestock protein requirements. Target: above 16% for lactating dairy cows.
NDF (Neutral Detergent Fiber): total structural fiber. Lower = higher intake capacity. Target: below 40% for dairy, below 55% for horses.
ADF (Acid Detergent Fiber): lignin and cellulose. Lower = more digestible energy. Target: below 32% for dairy.
RFV (Relative Feed Value): composite digestibility index. 100 = baseline. Above 150 = premium dairy hay. Above 185 = Supreme grade.
The Four Key Forage Quality Parameters Explained
Crude Protein (CP)Nitrogen × 6.25
CP measures the total nitrogen content of the hay multiplied by 6.25 (the theoretical conversion factor from nitrogen to protein). It is the most widely understood hay quality metric and the primary parameter for matching hay to livestock protein requirements. Boot-stage alfalfa reaches 20–24% CP; boot-stage grass hay 12–18%; post-bloom hay falls to 8–12%. Key limitation: CP as measured by the laboratory includes both digestible (available) protein and heat-damaged protein (ADICP — see the note on heat-damaged protein below). A high CP figure in hay that was baled too wet may overstate the nutritionally useful protein.
Neutral Detergent Fiber (NDF)Total structural fiber
NDF represents total cell wall fiber — cellulose, hemicellulose and lignin combined. This is the fiber fraction that physically fills the rumen and limits how much an animal can eat per day. Lower NDF means less physical fill per unit of hay, which means the animal can consume more dry matter before reaching the rumen capacity limit. This is why dairy nutritionists focus intensely on NDF: a cow on 35% NDF hay can eat significantly more dry matter per day than the same cow on 50% NDF hay, translating directly to higher milk production potential. NDF above 60–65% means the hay is physically limiting intake below the animal nutritional requirement.
Acid Detergent Fiber (ADF)Cellulose + lignin
ADF is the portion of NDF remaining after treating with an acid detergent solution — it represents cellulose and lignin, the least digestible components of plant cell walls. ADF is the primary predictor of digestible energy in hay: lower ADF means more of the hay is digestibly available as energy. The laboratory calculates TDN (total digestible nutrients) and NEL (net energy for lactation) directly from ADF using standard equations. ADF is also the basis for USDA hay grading — the lower the ADF, the higher the market grade.
Relative Feed Value (RFV)Composite index
RFV is a single composite index calculated from both ADF (which predicts digestibility) and NDF (which predicts intake capacity). The formula: RFV = (88.9 − 0.779 × ADF%) × (120 / NDF%) / 1.29. The baseline of 100 was set for full-bloom orchardgrass — a widely grown perennial grass at the stage where hay production and feed value are roughly in equilibrium. RFV above 100 means the hay delivers more value than that baseline; RFV 185 means the hay delivers 85% more digestible intake capacity than the baseline. RFV is the single most useful number for quickly comparing hays of different quality in commercial markets.
USDA and Industry Hay Grading Standards
The industry hay grading system used on forage test reports and in commercial transactions is based on the parameters above, with RFV as the summary index. The following table reflects the grading standards widely used by forage labs, dairy nutritionists and commercial hay buyers across the US:
| 등급 |
RFV |
ADF (%) |
NDF (%) |
CP (%) |
Primary Market |
| 최고 |
Above 185 |
Below 27% |
Below 34% |
Above 19% |
High-production dairy, performance horses, rabbits |
| 프리미엄 |
170–185 |
27–29% |
34–39% |
17–19% |
Lactating dairy cows, premium horse hay, Japan/Korea export |
| 1학년 |
150~170 |
29–32% |
39–43% |
14–16% |
Dairy (with supplementation), horses in moderate work |
| 2학년 |
130~150 |
32–35% |
43–47% |
11–14% |
Beef cattle, growing stockers, dry mares |
| Grade 3 |
110–130 |
35–38% |
47–51% |
8–11% |
Dry beef cows, bedding supplement, mature ruminants |
| Grade 4–5 |
Below 110 |
Above 38% |
Above 51% |
Below 8% |
Bedding, very low-quality roughage only. Minimal market value. |
How to Collect a Representative Hay Sample
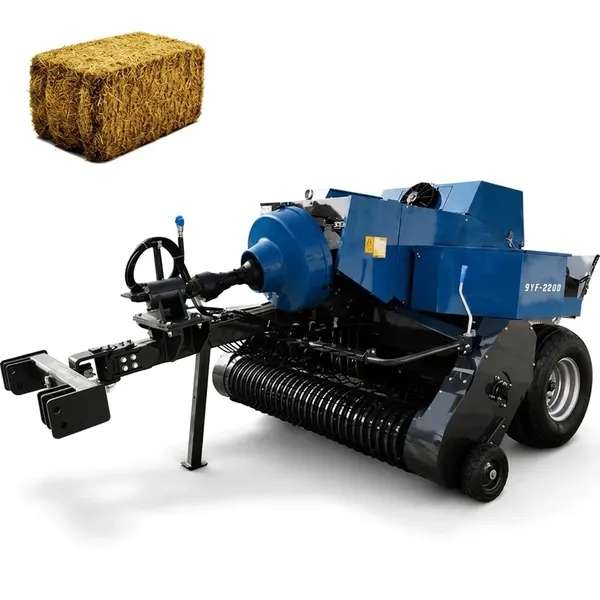
The quality of a forage test result is only as good as the sample. A single core from one bale is not a representative sample — forage quality varies between bales, between positions within a bale, and between fields and cuttings. The standard protocol for commercial hay sampling:
1
Define the lot. A lot is all hay from the same field, same cutting, and same baling session. Sample each lot separately — mixing samples from different fields or cuttings produces a result that represents neither accurately.
2
Core 20+ bales per lot. Use a Penn State forage sampler — a hollow coring tube with a sharp tip that is pushed to full depth at the end face of each bale. Push the sampler to full depth (approximately 40–45cm into the bale end) to capture core material, not just the outer layer. For round bales: core from the flat end face.
3
Combine all cores into one bag. Collect all cores from the 20+ bales into a single sealed plastic bag or forage sample bag. Shake or mix the combined sample before transferring to the submission bag. This composite approach averages the natural variation within the lot.
4
Submit promptly. Send the sample to a certified forage analysis laboratory within 24–48 hours of collection. Hay samples in sealed bags continue to respire and can shift in moisture and biochemistry over time. Use a courier or overnight mail for the fastest turnaround. Refrigerate the sample (do not freeze) if shipping is delayed.
5
Request the right panel. For commercial hay sales: request CP, NDF, ADF, moisture, ash and RFV — the standard dairy/equine hay panel. For horse hay targeting laminitis-sensitive markets: add NSC (non-structural carbohydrates). For export: add ash if Japan/Korea specifications require it.
How to Read a Forage Test Report
The As-Fed vs Dry Matter Basis Distinction
As-Fed Basis (AF): All values expressed as a percentage of the hay as it is fed — including the moisture content. A hay with 85% dry matter and 14% CP on a dry matter basis shows 11.9% CP on an as-fed basis. As-fed figures are lower than dry matter figures for all parameters.
Dry Matter Basis (DM): All values expressed as a percentage of the dry matter content only — moisture is removed from the calculation. Most forage quality comparisons and grading standards are based on dry matter figures. When comparing hay from different sources, always compare on a dry matter basis.
Practical rule: compare DM basis figures between different hay samples. Use as-fed basis figures when calculating rations for livestock that receive a known weight of hay per day.
Heat-damaged protein (ADICP): If the lab reports ADICP (acid detergent insoluble crude protein) above 7–8% of total CP, the hay underwent significant heating after baling. This fraction of CP is bound to cell wall fiber and is not digestible — the effective protein available to the animal is lower than the total CP figure suggests. High ADICP is caused by baling above 20% moisture and is a marker of hay quality that buyers increasingly request on premium dairy and export markets.
How Forage Test Results Translate to Market Value
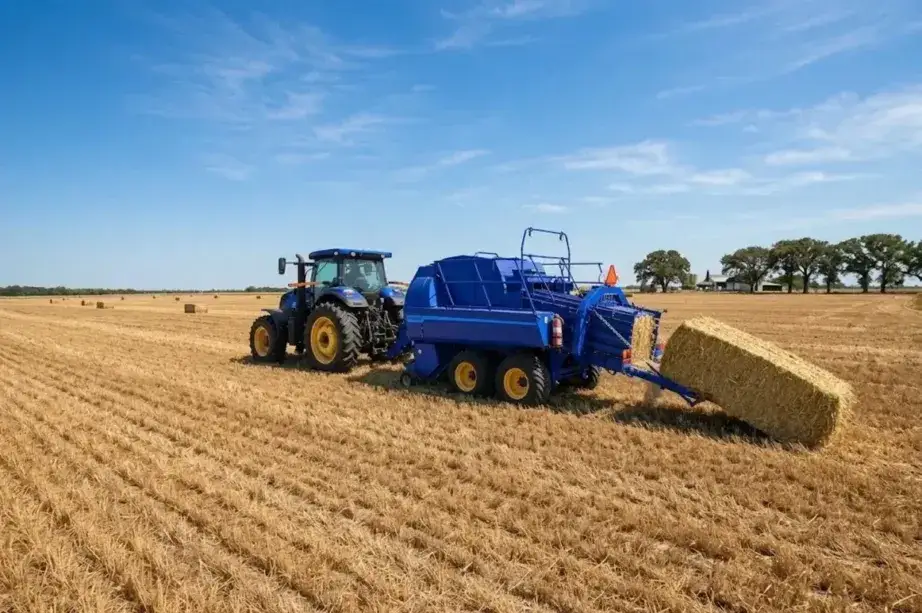
Forage test results generate measurable price premiums and penalties in the commercial hay market. Dairy buyers pay by the forage test — a nutritionist adjusts the ration and the farm pays the price that reflects the nutritional value delivered. Horse hay buyers increasingly request test certificates. Export buyers to Japan and Korea specify minimum test parameters as contract conditions.
| Buyer Type |
Key Parameters Specified |
Price Premium Mechanism |
| Dairy farm (lactating cows) |
CP above 16%, NDF below 40%, RFV above 150 |
Price per tonne negotiated from test — $15–$30/tonne premium for Supreme vs Grade 1 in competitive markets |
| Horse hay retail / feed store |
CP, NSC (for metabolic horses), visual quality, moisture |
Test certificate included in premium bale pricing; buyers accept premium price when test backs the visual quality claim |
| Japan/Korea export buyer |
Moisture below 17%, Ash below 2%, CP by variety, visual grade |
Contract price set against specifications — failure to meet specifications triggers price penalty or rejection |
| Beef cattle buyer |
CP above 8–10% for maintenance; no mold |
Typically buys by visual inspection; test used when receiving poor cow performance that prompts quality investigation |
How Baling Decisions Directly Affect Your Forage Test Result
Cutting StageThe largest single factor in forage quality outcome. Cutting at boot stage versus 2 weeks post-bloom changes CP by 4–8% and RFV by 30–60 points — the difference between Grade 1 and Supreme on the same stand. Owning your own baler provides schedule independence to cut at the correct stage regardless of custom operator availability.
베일링 수분Baling above 20% causes heating that produces ADICP — heat-damaged protein that reduces digestible CP below the measured total CP. Baling below 12% causes leaf shatter that reduces leaf content (where CP is concentrated in grass hay) and increases stem content (where NDF and ADF are concentrated). Target 14–17%.
Ash ContentSoil pickup from tines running too low increases the ash percentage measured on the forage test. High ash dilutes the nutritive value per unit of hay as weighed. Correct pickup height and spring-tooth (rather than hammer-claw) pickup reduces soil contact and produces lower ash results — critical for the Japan/Korea export market (ash below 2% specification).
Equipment That Preserves Forage Quality at Baling
Consistent PTO speed at 540rpm through the baling session ensures uniform plunger compression force per bale — producing consistent bale density that in turn delivers uniform moisture distribution throughout each bale. A bale with uneven density (from PTO speed fluctuation) has variable moisture pockets that produce inconsistent forage test results across the lot and increase the risk of localized heating in the denser, higher-moisture sections. Full PTO speed guide: PTO driveshaft maintenance for consistent forage quality baling.
Frequently Asked Questions — Forage Quality Testing
How much does a forage quality test cost?+
A standard forage quality test panel (CP, NDF, ADF, moisture, ash, RFV) costs $18–$35 per sample at most certified US forage testing laboratories, with results typically available in 2–5 business days. A comprehensive panel adding NSC, ADICP, minerals and specific amino acids costs $45–$75. Expedited 24-hour turnaround is available from most labs at a premium of $10–$20. For commercial hay producers testing each cutting of each field: the annual testing cost is $50–$200 per year for a typical small-to-medium operation — a minor cost relative to the pricing premium a confirmed Supreme-grade result can generate. The Penn State forage sampler (coring tool) is a one-time purchase at $30–$80 from farm supply stores or university extension offices.
Is RFV or RFQ a better indicator of hay quality?+
RFQ (Relative Forage Quality) is a more recent index that accounts for the different digestibility characteristics of different forage types — particularly the fact that legume fiber (alfalfa, clover) is more digestible than grass fiber at the same NDF level. RFV uses a single NDF-to-intake equation for all forages; RFQ adjusts the digestibility estimate for the specific forage type. For alfalfa hay: RFQ is generally considered the more accurate predictor of dairy cow milk production response because it accounts for the high digestibility of alfalfa cell wall fiber. For grass hay: the difference between RFV and RFQ is smaller, and RFV remains widely used and understood in commercial grass hay markets. Many forage labs now report both indexes. When selling to dairy buyers: confirm which index they use in their purchasing specifications — some dairy nutritionists have shifted to RFQ for alfalfa evaluation but retain RFV for grass hay evaluation.
Can I test hay after it has been in storage for 6 months?+
Yes — hay can be tested at any point in its storage life and the result is valid for that hay at that time. The test result reflects the current nutritional status of the hay, which may differ from what it would have shown at baling if any deterioration has occurred during storage. Key changes that occur during storage: moisture loss in outdoor-stored bales (changes the as-fed vs dry matter relationship); weathering of the outer bale layer reduces CP and increases ADF and NDF in the affected zone; and any heating that occurred in the weeks after baling will show elevated ADICP in the test. For hay that was stored correctly and shows no visible deterioration: the test result at 6 months will be close to the result at baling. For hay that weathered outdoors without net wrap: core from the interior of bales (avoiding the outer 10–15cm) for a sample that represents the unconsumed hay quality — the outer layer is often significantly lower quality and will depress the composite result.
Why is my hay testing lower quality than expected for the cutting stage?+
Several factors can produce a lower test result than the cutting stage would predict. Sampling bias: cores taken primarily from the outer bale surface rather than to full depth will over-represent the weathered outer layer and under-represent the higher-quality interior. Uneven cut stage across the field: grass stands that are uneven in maturity produce bales where some material was boot stage and some was already in bloom — the composite result reflects the average, which is lower than the purest boot-stage material. Nitrogen deficiency: a stand with inadequate nitrogen will test lower in CP at the same growth stage as a well-fertilized stand — the plant cannot synthesize protein from nitrogen that is not available. Dilution by low-quality material: weeds in the windrow, particularly broadleaf species at advanced maturity, significantly reduce the composite quality of the lot. And heat damage: if the hay was baled at 19–22% moisture and experienced a heat cycle, ADICP may be elevated and effective CP is lower than the total CP figure suggests.
Which certified forage testing laboratories should I use in the US?+
The National Forage Testing Association (NFTA) maintains a list of certified forage testing laboratories that meet standardized proficiency requirements. Widely used certified laboratories include Dairy One (Ithaca, NY — extensive dairy forage panel), Ward Laboratories (Kearney, NE — strong Great Plains presence), Rock River Laboratory (Watertown, WI), Midwest Laboratories (Omaha, NE) and multiple university extension forage labs (University of Kentucky, Virginia Tech, University of Wisconsin). For export testing (ash, pesticide residue, phytosanitary compliance): confirm the laboratory is accredited for the specific test required by the import country — Japan and Korea have specific approved laboratory lists for import certification purposes.
What is NSC and why does it matter for horse hay?+
NSC (non-structural carbohydrates) is the fraction of the hay that consists of sugars and starches — the rapidly fermentable carbohydrate fraction that converts to lactic acid in the horse hindgut when consumed in excess. High NSC intake in metabolically sensitive horses (those with insulin dysregulation, EMS — equine metabolic syndrome, or prior laminitis) triggers insulin spikes that can precipitate a laminitis episode. Veterinarians managing these horses typically specify hay with NSC below 10–12% on a dry matter basis. NSC is not calculated from the standard NDF/ADF equations — it must be specifically requested and measured by the laboratory. Grass hays cut at early boot stage in cool, sunny conditions can have NSC above 15%; the same hay cut later in warmer conditions or after a stress period may be significantly lower. For producers marketing hay to the metabolic horse market: NSC testing adds $8–$15 to the test cost and is a significant differentiator that justifies a premium price in this niche.
Do I need to test every cutting from the same field?+
For commercial hay sales: test every cutting. The quality profile of alfalfa first cut (high yield, often lower CP at early bloom vs late boot cutting), second cut (peak quality in many management systems) and third cut (variable quality depending on summer conditions) can vary enough to place them in different market grades. Selling all cuttings from a field under a single first-cut test result risks misrepresenting the quality of subsequent cuttings in either direction. For own-use beef cattle hay: testing once per year per field is generally sufficient — beef cattle quality requirements are less sensitive to within-year quality variation. For export and premium dairy markets: some buyers require testing every cutting and every lot with a test certificate attached to the shipment. Establish the testing frequency requirement from your buyer before production and design the testing program to meet their documentation needs.
How does ash content affect the forage test result and the price?+
Ash is the mineral residue remaining after all organic matter is burned — in clean hay it represents plant minerals (calcium, phosphorus, potassium, etc.) at typically 6–10% DM for legumes and 5–8% DM for grasses. When soil is picked up during raking or baling, the soil mineral content significantly increases the ash figure — soil ash at 5% inclusion in the bale adds approximately 2–3 percentage points to the measured ash value. High ash from soil contamination reduces the effective nutritional value per unit of hay because the soil minerals dilute the plant nutrients without providing equivalent livestock nutrition. For the Japan and Korea export market: ash above 2% typically triggers price penalties or rejection — this is why the 9YFS-2.2 fan system (which actively removes fine soil particles during baling) is specifically valued for these markets. For domestic hay: ash above 12% in alfalfa or 10% in grass hay is an indicator of significant soil contamination that most buyers will discount or reject.
Ready to Produce Hay That Tests at the Grade Your Market Pays For?
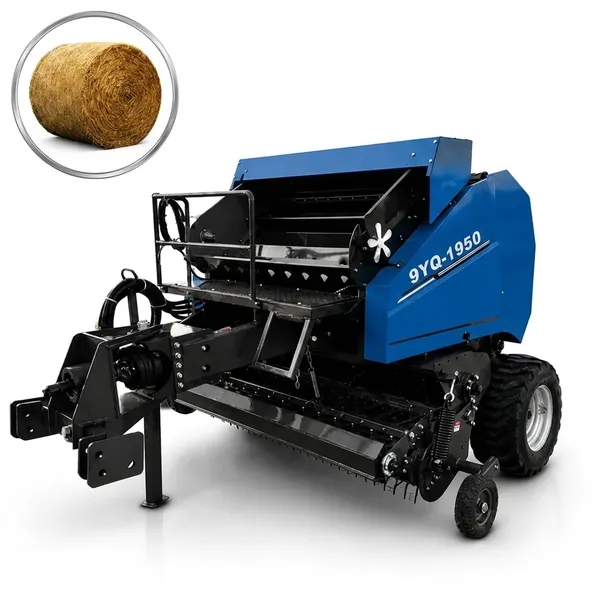
Tell us your target market and forage grade and we will confirm which 9YF square baler 또는 9YQ round baler and management approach is the right fit for your operation.
아메리카 에버파워 사료 베일러 장비 주식회사 · 1401 21번가 R호, 새크라멘토, 캘리포니아 95811
편집자: Cxm