UN forage analysis report arrives from the laboratory as a dense page of acronyms and percentages. Most hay producers look at one or two numbers — usually crude protein — and discard the rest. That approach leaves real money on the table, because the numbers that most directly affect what an elevator or dairy buyer will pay are not always the ones operators focus on. This guide walks through the key parameters of a hay test results report in plain language, explains the economic relationship between each number and your market, and shows how harvest decisions either build or undermine the scores before the sample is ever cut.
Why Every Hay Producer Should Test — and What It Costs Not To
A certified NIRS (near-infrared reflectance spectroscopy) forage test costs $15 to $25 per sample at accredited laboratories in the U.S., including Dairy One, Rock River Laboratory, and most state land-grant university forage labs. One sample represents a statistical composite of 12 to 20 core samples pulled from a representative set of bales from a single cutting. The test takes 24 to 48 hours and produces a report that is accurate to within 1 to 2 percentage points on the major parameters.
The cost of not testing is harder to quantify but consistently larger than the $25 test fee. The most common non-testing cost is selling Grade 1 hay at Grade 2 prices because the seller cannot document quality with a certified lab report. In active hay markets, certified forage analysis documentation commands a $5 to $15 per ton premium over untested lots simply because buyers can bid with confidence. On 50 tons of alfalfa hay, that documentation premium is $250 to $750 per cutting — paid directly for a $25 test investment.
The Core Four: NDF, ADF, Crude Protein, and TDN Explained
Of the 15 to 25 numbers on a standard forage analysis report, four parameters drive the grading decisions that most U.S. hay buyers use. Understanding what each measures — and the direction in which improvement lies — is the foundation of reading any hay test results report correctly.
The Core Four Forage Parameters — What Each Measures and Which Direction Is Better
↓
NDF
Neutral Detergent Fiber
Lower is better. NDF measures the total cell-wall fiber fraction — the structural components that limit intake. High NDF physically fills the rumen before caloric needs are met, reducing daily intake.
Premium dairy alfalfa: <34%
Good beef hay: 38–48%
Mature grass hay: 55–70%
Lower is better. ADF measures the least digestible fiber components — cellulose and lignin. As ADF rises, digestible energy (TDN) falls in a near-linear inverse relationship. ADF directly determines RFV score.
Premium dairy alfalfa: <27%
Grade 1 alfalfa: 27–29%
Grade 2 alfalfa: 29–32%
Higher is better. CP is calculated from nitrogen content × 6.25. It is the primary protein value in ration balancing and the most buyer-visible quality number. CP falls with each week of delay past early-bud cutting stage.
Late-bud alfalfa: 20–22%
Early bloom: 17–19%
Full bloom: 15–17%
↑
TDN
Total Digestible Nutrients
Higher is better. TDN is the estimated total digestible energy fraction, calculated primarily from ADF. It is the energy currency of ration balancing — a dairy cow’s milk production is directly linked to the TDN density of her ration.
Premium alfalfa: 62–68% TDN
Good grass hay: 55–62%
Mature forage: 45–54%
The NDF/ADF relationship: ADF is always a subset of NDF on any report. If your ADF is rising, your NDF is also rising — but the inverse is not necessarily true. When you see ADF and NDF moving in opposite directions on sequential cuttings, flag it for re-sampling — laboratory or sampling error may be involved.
RFV and RFQ: The Composite Grade Score and How It Is Calculated
Relative Feed Value (RFV) is the composite index most U.S. hay elevators and livestock buyers use to grade and price hay. It combines two derived values — digestible dry matter (DDM) and dry matter intake (DMI) — into a single number that represents the feeding value of the hay relative to a reference forage (full-bloom alfalfa = RFV 100).
RFV Calculation — Step by Step from ADF and NDF
Step 1 — From ADF
DDM = 88.9 − (0.779 × ADF%)
Digestible Dry Matter
At ADF 28%: DDM = 88.9 − 21.8 = 67.1%
Step 2 — From NDF
DMI = 120 ÷ NDF%
Dry Matter Intake
At NDF 38%: DMI = 120 ÷ 38 = 3.16%
Step 3 — RFV Score
RFV = (DDM × DMI) ÷ 1,29
Final grade index
(67.1 × 3.16) ÷ 1.29 = 164 RFV
RFV Grade Thresholds — U.S. Market Standards
RFQ (Relative Forage Quality) uses IVTDMD instead of ADF-derived DDM and provides a more accurate prediction of animal performance on legumes; some dairy buyers now specify RFQ over RFV. If your buyer uses RFQ, confirm which formula they apply before submitting samples.
Reading a Real Forage Analysis Report — Field-by-Field Walkthrough
A standard certified forage analysis report contains more parameters than the core four. The following annotated mock report covers the fields most commonly misread or overlooked by producers receiving their first lab report.
FORAGE ANALYSIS REPORT — ILLUSTRATIVE EXAMPLE
Sample ID: 2025-ALF-2ND-CUT
| Paramètre |
As Fed |
Dry Matter |
Explanation |
| Humidité % |
13.2 |
— |
Ⓐ Baled at 13.2% — within safe dry hay range (≤20%). Above 20% = risk zone. |
| Crude Protein % |
18.4 |
21.2 |
Ⓑ Always use DM basis for comparison. As-fed is lower because it includes the moisture weight. |
| ADF % |
23.1 |
26.6 |
Ⓒ ADF 26.6% DM = Premium grade. Every 1% ADF increase above 27% reduces RFV by approximately 4 points. |
| NDF % |
31.8 |
36.6 |
Ⓓ NDF 36.6% = high intake potential. Controls DMI in the RFV formula. Always > ADF on the same sample. |
| TDN % |
59.4 |
68.4 |
Ⓔ 68.4% TDN DM = strong energy density. Calculated from ADF. Compare on DM basis only. |
| NEL (Mcal/kg) |
0.67 |
1.56 |
Ⓕ Net Energy for Lactation — dairy-specific energy value. 1.56 Mcal/kg DM is premium dairy quality. |
| RFV (calculated) |
— |
192 |
Ⓖ RFV 192 = Premium grade. Calculated from ADF/NDF using DDM × DMI ÷ 1.29 formula above. |
Circled letters ⒶⒷⒸⒹⒺⒻⒼ reference the explanation column. All percentage values are illustrative; your actual report will vary by cutting stage, crop variety, and field conditions. Always request the certified original forage analysis report from the laboratory, not a scanned copy.
How Your Harvest Decisions Write Your Forage Analysis Score Before Sampling
A forage analysis report is a measurement of decisions already made. By the time the sample reaches the laboratory, the ADF, NDF, and CP values are fixed — the harvest, curing, and storage events that generated them are history. Understanding the connection between specific decisions and their numeric outcome is the only way to systematically improve scores cutting over cutting.
Cutting Stage → ADF + CP
Each week of delay past early-bud stage adds approximately 1.5 to 2.5 percentage points of ADF and removes 1 to 2 percentage points of CP in alfalfa. On a 2-week delay from late-bud to early-bloom: ADF increases ~4%, RFV drops ~16 points. The single highest-leverage forage analysis improvement available.
Curing Speed → WSC + RFV
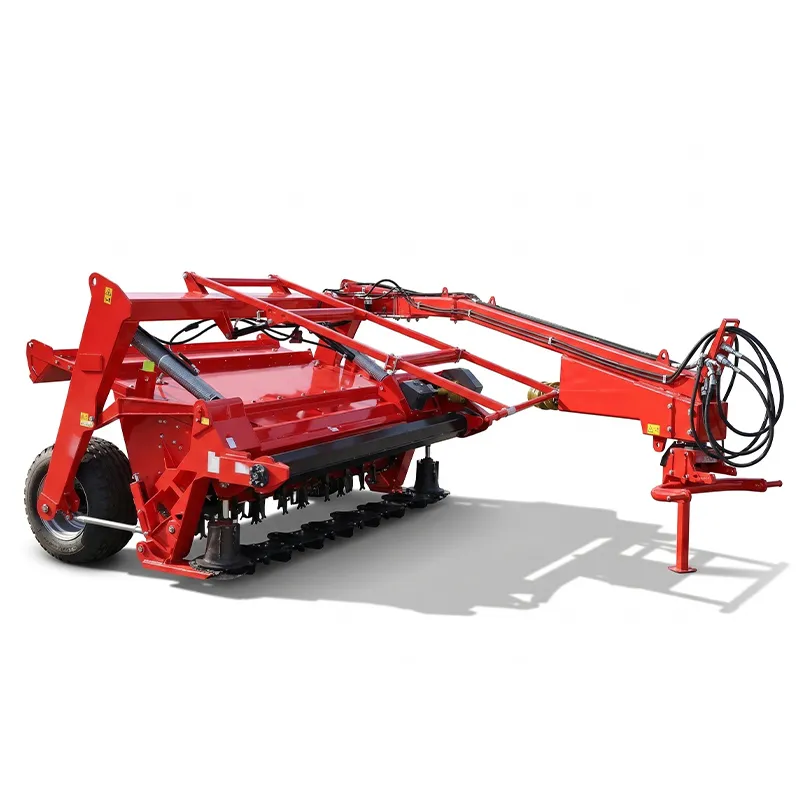
Every additional hour of field curing after the optimal window consumes 0.5 to 1.5% of dry matter as water-soluble carbohydrate respiration loss. WSC decline raises ADF on a relative basis — exactly what the forage analysis RFV formula penalizes. Using a mower-conditioner shortens curing time by 25 to 40%, preserving WSC and RFV.
Bale Density → Ash + Contamination
Soil contamination from low cutting height or aggressive rake tine contact adds ash content to the sample. Elevated ash (above 10% DM) dilutes the protein and energy fractions on a percentage basis, reducing apparent quality even when the actual hay is clean. Consistent bale density depends on the
boîte de vitesses agricole maintaining stable PTO torque throughout the bale cycle — tension variations caused by gearbox wear produce uneven density that compounds soil pick-up at the bale surface.
Storage Losses → Apparent CP Increase
Counter-intuitively, poor outdoor storage can produce a higher apparent CP on DM basis — because DM (carbohydrates and fiber) degrades faster than protein in aerobic spoilage, concentrating the CP percentage in the remaining dry matter. This is a trap: the absolute protein yield per ton is lower, even as the percentage looks higher. Always consider DM recovery alongside the analysis numbers.
Frequently Asked Questions: Forage Analysis Reports
How many bales should I sample to get a representative forage analysis result?+
The standard recommendation from Dairy One and most extension services is 15 to 20 core samples pulled from randomly selected bales across a single cutting lot, combined into one composite sample for analysis. Core samples should be taken from the flat end face of round bales using a 45 to 60 cm coring probe — not from the outer curved surface, which is biased toward the outer layer and does not represent interior quality. For lots above 100 bales from a single cutting, run two composite samples and average the results. For high-value dairy hay sales where individual lot certification is required, sample each cutting separately even if stacked in the same storage site.
My forage report shows high crude protein but low RFV. Is this possible?+
Yes, and it is actually a common pattern in one specific scenario: late-cut grass hay or mature mixed hay where soil contamination has elevated the ash content. High ash concentrates CP percentage artificially (see storage losses section above), while simultaneously high ADF from mature stems suppresses RFV. The combination produces a report that looks protein-rich but RFV-poor. The second common cause is heat-damaged protein: when hay is baled too wet and heats in the stack, the protein becomes heat-bound (bound-ADF protein) and is not biologically available to the animal even though it tests as CP. Look for the ADICP (acid detergent insoluble crude protein) value on your report — values above 10% of CP indicate heat damage.
Does the NIRS test method produce accurate results for grass hay as well as alfalfa?+
NIRS equations are calibrated to specific crop types and their accuracy varies by how well your specific crop matches the calibration database. Alfalfa NIRS calibrations are the most robust in the industry due to large sample databases. Cool-season grass calibrations (orchardgrass, timothy, fescue) are also well-developed. Where NIRS accuracy drops is on unusual species mixes, tropical grasses (bermudagrass, bahiagrass), or samples with high soil contamination — the mineral background confounds the spectral equations. For tropical grass programs or unusual mixes, request wet chemistry verification of at least one parameter (typically CP or NDF) to confirm the NIRS prediction is tracking correctly for your crop type.
My second-cut alfalfa always tests better than first-cut. Why?+
Second-cut alfalfa consistently produces better forage analysis scores than first-cut for three structural reasons. First, second-cut growth typically occurs in midsummer when the leaf-to-stem ratio is higher — the plant’s vegetative growth phase produces more leaf and less lignified stem than the spring first-cut surge. Second, first-cut alfalfa regrows from winter dormancy with more ADF-rich stem material — the crown’s carbohydrate reserves push rapid elongation of structural tissue before the first leaves expand. Third, weather conditions during curing differ: second-cut is more likely to encounter warm, dry drying conditions in most U.S. regions, reducing field losses. If your first-cut ADF is consistently 3 to 5 points higher than second-cut, this is normal — plan your market accordingly by reserving second-cut for premium dairy sales.
What is a good RFV target for selling to a horse market?+
Horse buyers — particularly performance horse and pleasure horse markets — have different and sometimes counterintuitive quality preferences compared to dairy buyers. Most horse buyers specify RFV 100 to 150 for grass hay and RFV 140 to 170 for alfalfa. Very high RFV alfalfa (above 185) is often considered too rich for pleasure horses and mature stock horses — high protein and energy loads in horses are associated with behavioral issues and metabolic conditions such as laminitis in sensitive animals. Some horse hay buyers specifically request mid-range CP (16 to 18%) alfalfa rather than premium CP (20 to 22%) because the lower protein reduces the dietary nitrogen load in horses with kidney sensitivity. Always ask your specific horse hay buyer what they specify rather than assuming higher RFV is always better.
How should I handle a forage report that shows results I don’t believe are accurate?+
Forage analysis results that seem inconsistent — unusually high or low values on any major parameter — should be investigated before accepting or disputing them. Step 1: Check whether the result is reported on an as-fed or dry-matter basis, and confirm you’re comparing the right column against your expectation. Step 2: If you suspect sampling error (contaminated samples, wrong cutting lot mixed in), re-sample from the same lot using proper coring technique and submit a second sample. Step 3: If re-sampling produces a similar result, request wet chemistry verification from the laboratory — NIRS predictions on unusual samples can diverge from wet chemistry. Most accredited labs offer wet chemistry re-analysis at additional cost. Step 4: If wet chemistry confirms an unexpected result, investigate the agronomic cause — check for soil contamination, heat damage indicators (ADICP), or verification that the sample came from the correct cutting lot.
Hay Quality Equipment — California Warehouse
Match Your Harvest Equipment to the Forage Analysis Scores You Need
Our California team works through forage analysis targets by market channel and recommends the mowing, raking, and baling equipment configuration most likely to achieve them consistently. Direct factory pricing on all models, same-day parts dispatch, and no dealer margin.
✔ Analysis Consultation
Report reviewed with your targets
Get Help Interpreting Your Test
Éditeur : Cxm